
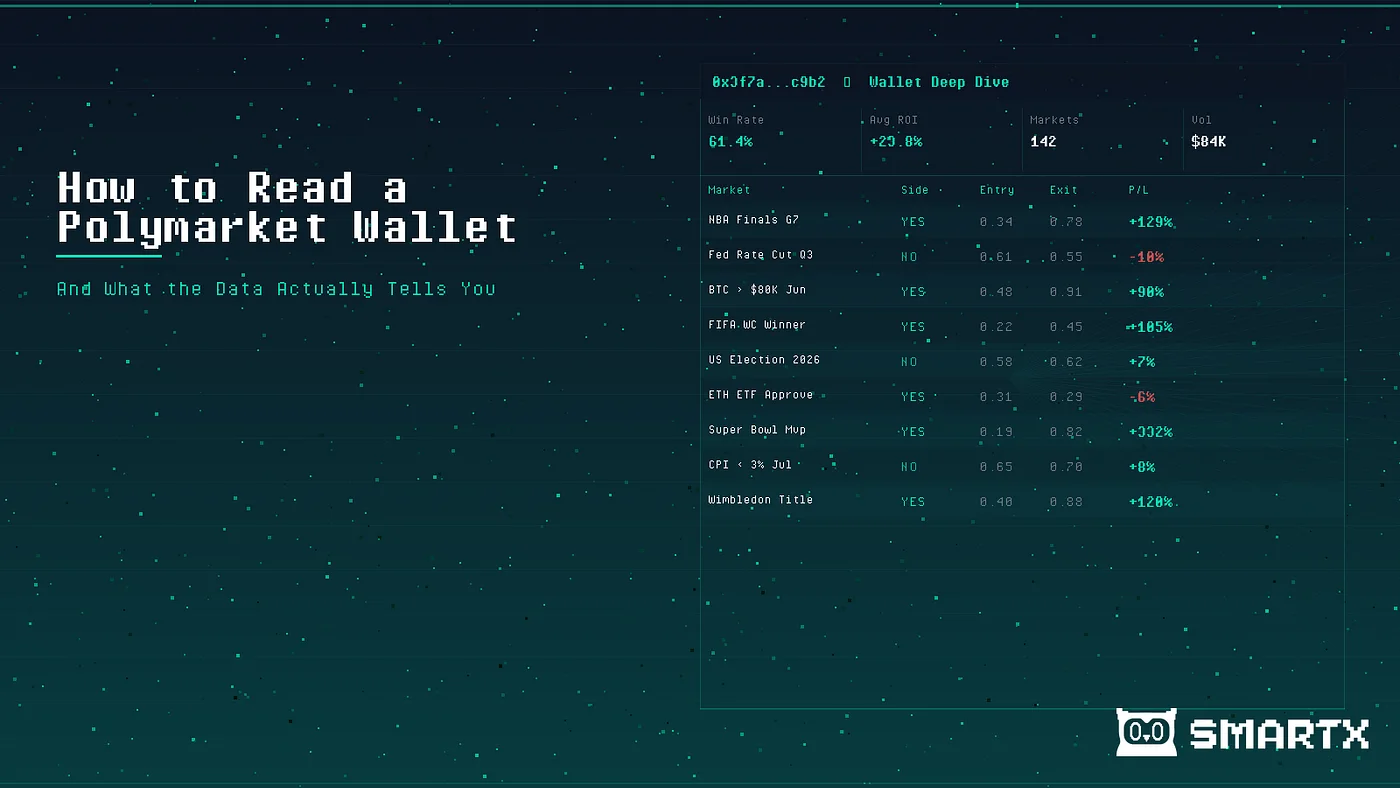
Start with win rate vs. implied probability
One of the most common things a Polymarket trader does when researching is pull up a wallet address and stare at it. The trade history is right there: a list of markets, positions taken, whether they resolved YES or NO, and a profit number at the end. The problem is that this raw data is almost impossible to interpret usefully without knowing what to look for. Is a 60% win rate good? It depends entirely on what probability those bets were placed at. Is a $500,000 profit impressive? It depends on whether that came from 10 bets or 10,000.
Reading a wallet correctly means looking past the headline numbers and into the structural patterns underneath. This is the skill that separates traders who actually learn something from a leaderboard from those who just copy a green number and wonder why it doesn’t work for them.
The single most important thing to check in any wallet is whether the win rate is above the average implied probability of the positions taken. A wallet with a 65% win rate looks impressive — until you learn that 80% of its bets were on favorites priced at 75% or higher. That’s not edge; that’s below-expectation performance.
Conversely, a wallet with a 48% win rate that consistently bets on outcomes priced at 35% is running a significant positive expected value. The win rate number alone tells you almost nothing without the pricing context.
Most wallets don’t make this easy to calculate manually. But the pattern shows up when you look at the types of markets being traded: high-priced YES bets in obvious favorites tend to indicate a wallet following the crowd. Consistent positions in markets that resolve higher than their entry price indicate genuine analytical edge.
Bet frequency and average size tell you the strategy
A wallet placing 3,000 bets per week with an average size of $400 is playing a fundamentally different game than one placing 12 bets per week at $25,000 each. The first is likely running some form of automated or semi-automated market making or arbitrage. The second is a conviction-based trader sizing up on high-confidence opportunities.
Trying to follow the high-frequency wallet by copying individual bets is a mistake — by the time you see the bet, process it, and execute, the market has often already moved. The value in a high-frequency wallet is not in copying its positions but in understanding what categories it’s active in and what that activity signals about liquidity conditions.
The conviction wallet is more followable, but only if your thesis for the market aligns with theirs. Copying a bet sized at $25,000 into a market you haven’t researched is just hoping someone else’s conviction transfers to your outcome.
Category concentration reveals real expertise
Almost every consistent Polymarket winner has category concentration: they do most of their volume in one or two market types and have meaningfully better results there than in categories they trade less.
When reading a wallet, check whether the majority of volume is concentrated in a specific category, and then check whether the win rate in that category is above average compared to the wallet’s overall performance. Category specialists with a clear track record in their domain are meaningfully more useful to study than generalists with similar overall numbers — because the specialist’s edge is more likely to be structural and repeatable.
A wallet with 80% of volume in sports markets and a 58% win rate in sports but only 44% in political markets is telling you something clear: the edge is in sports, not in the trader’s overall judgment about market prices.
Flip rate shows conviction and holding behavior
Flip rate — the percentage of positions closed before resolution — tells you whether a wallet trades its convictions or follows momentum. A near-zero flip rate means the wallet almost never exits early: it places a bet based on its analysis and lets it ride to resolution. A high flip rate suggests the wallet is more active in trading probabilities as they shift rather than holding through market noise.
Neither is inherently better, but they require different behavior to shadow. If you’re following a low-flip wallet and exit a position when the price moves 10 points against you, you’re adding a different decision layer on top of theirs — one that may not align with how their edge works.
What SmartX reads for you automatically
All of these signals — win rate vs. implied probability, bet frequency, category concentration, flip rate — are present in on-chain data. The difficulty is that pulling them manually for each wallet you want to evaluate takes significant time and some data manipulation skill.
SmartX reads these patterns automatically. Every wallet on Polymarket is tagged by its behavioral profile: whether it’s a Market Maker, a conviction-based Consistent Winner, a Short-term momentum trader, or a Whale moving markets. The category-specific performance is surfaced directly, so you can see not just that a wallet has a good overall record but that its good record is concentrated in sports markets between specific volume ranges.
The practical output: instead of staring at a raw trade list trying to figure out what it means, you open a wallet and see immediately whether its edge is real, what category it’s concentrated in, and whether it’s the kind of trader you can actually learn from or follow.
LIVE ON POLYMARKET