
Build a feedback loop, not a scoreboard
Most Polymarket traders have a rough sense of whether they’re up or down. Very few have a precise, actionable view of their returns across categories, position types, and time horizons. That gap — between knowing you’re profitable and knowing why you’re profitable — is the difference between a trader who can sustain their results and one who can’t.
Tracking prediction market returns properly is less about celebrating wins and more about building a feedback loop that makes you better over time.
Why total P&L is the wrong metric
Total P&L tells you the outcome. It doesn’t tell you anything about your process. Two traders can both show $5,000 profit over three months — one through consistent edge in a specific category, one through a single lucky bet that obscures a losing record everywhere else. Only one of those is repeatable.
The metrics that actually matter
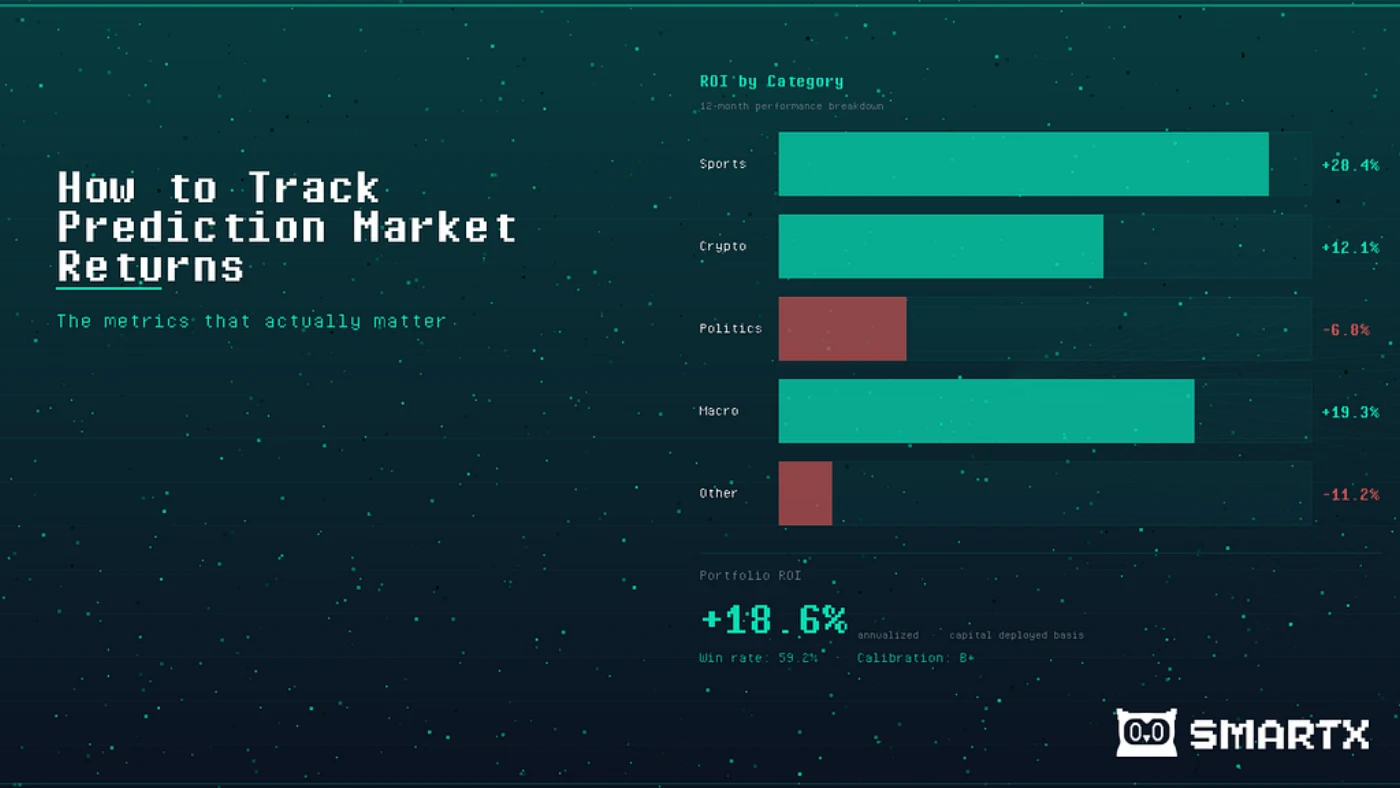
Win rate by category: what percentage of your NBA trades resolve in your favor? Your political markets? If you’re 62% on sports and 44% on politics, that’s not a sign to improve your political analysis — it’s a signal to stop trading politics.
ROI on capital deployed: total profit as a percentage of total capital put to work, broken down by category and by time horizon. A 15% ROI in markets that resolve within a week is very different from 15% ROI in markets that take three months.
Average position sizing vs. outcome: do your larger positions perform better or worse than smaller ones? If your high-conviction trades underperform your standard trades, your calibration needs work.
Calibration: when you thought something was 70% likely, did it happen about 70% of the time? A well-calibrated trader with 55% win rate is in much better shape than a miscalibrated trader with 60%.
Building a simple tracking system
You don’t need sophisticated software to track prediction market returns well. A spreadsheet with the following columns covers most of what matters: market name, category, direction (YES/NO), entry price, exit price, position size, P&L, resolution date, and a one-line note on your thesis.
Review this monthly. Look for patterns: categories where you consistently win, position types that underperform, markets where you over-sized relative to your edge.
The compounding effect of good tracking
Traders who track their performance carefully have a significant long-term advantage over those who don’t. It’s not just that they improve faster — it’s that they learn to deploy capital where their edge is highest, avoid categories where they consistently underperform, and adjust position sizing based on historical calibration data.
Over 12–18 months, this compounds significantly. A trader who knows their edge is in sports markets and deploys 80% of their capital there will almost always outperform a generalist.
SmartX is designed to automate this tracking process — your trade history analyzed by category, calibration, and sizing patterns, without building the spreadsheet yourself.
Start tracking what actually matters at https://app.smartx.io/?ref=hwGjVafr.
LIVE ON POLYMARKET